What Are Developer Tools?
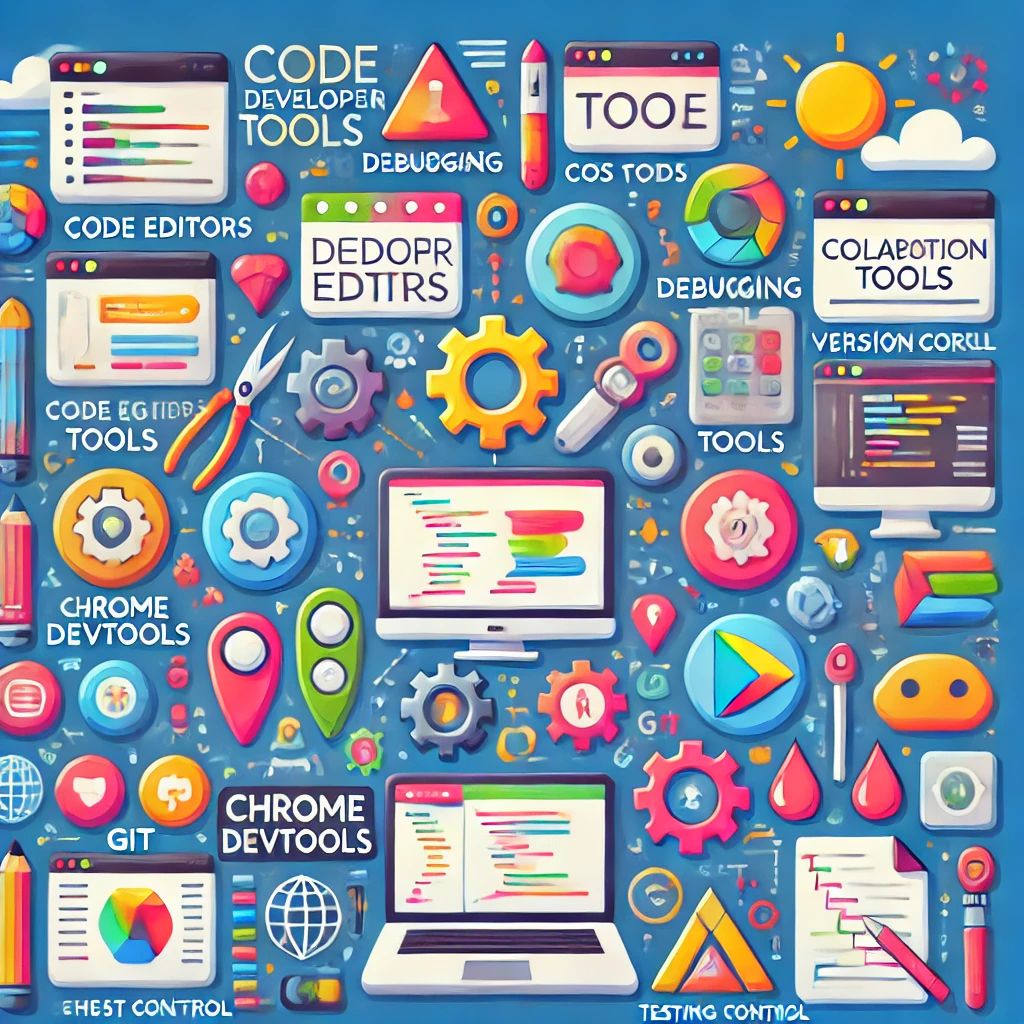
Imagine you’re assembling furniture from IKEA. To make the process easier and quicker, you use specific tools like an Allen wrench, screws, and the instruction manual. Developer tools are like those special tools for software engineers who make websites and apps! They help developers build, test, and fix their creations.

Why Do We Need Developer Tools?
- Speed: Just like a power drill helps you assemble furniture quickly, developer tools let developers write and organize code faster.
- Fixing Problems: If your newly assembled table wobbles, you need to find out why. Developer tools help find and fix problems in websites or apps, just like a level helps you identify and correct uneven legs on your furniture.
- Testing: Before you invite friends over to see your new furniture, you want to make sure it’s sturdy and functional. Developer tools let developers test their websites and apps to make sure everything works well, just like you’d test the stability and comfort of your newly built chair.
Types of Developer Tools
| Type | Description |
|---|---|
| Code Editors | This is like having a special workshop for crafting. Visual Studio Code (VS Code) and Sublime Text are examples that help organize your materials and make it easier to see what you’re working on. |
| Debugging Tools | Imagine you’ve built a birdhouse, but the birds aren’t using it. Debugging tools, like Chrome DevTools, help you find and fix the issues in your code, just like you’d inspect each part of the birdhouse. |
| Version Control | This is like taking snapshots of your art project at different stages. Git helps keep track of changes, so if something goes wrong, you can easily go back to a previous version. |
| Testing Tools | Before you hang a picture frame, you’d make sure it’s level and secure. Similarly, tools like Jest help developers test if their code works correctly before using it. |
| Collaboration Tools | If you’re working on a group art project, you need to coordinate. Tools like GitHub help developers work together on big projects, even if they’re in different locations. |
Debugging with Chrome DevTools
What is the Console?
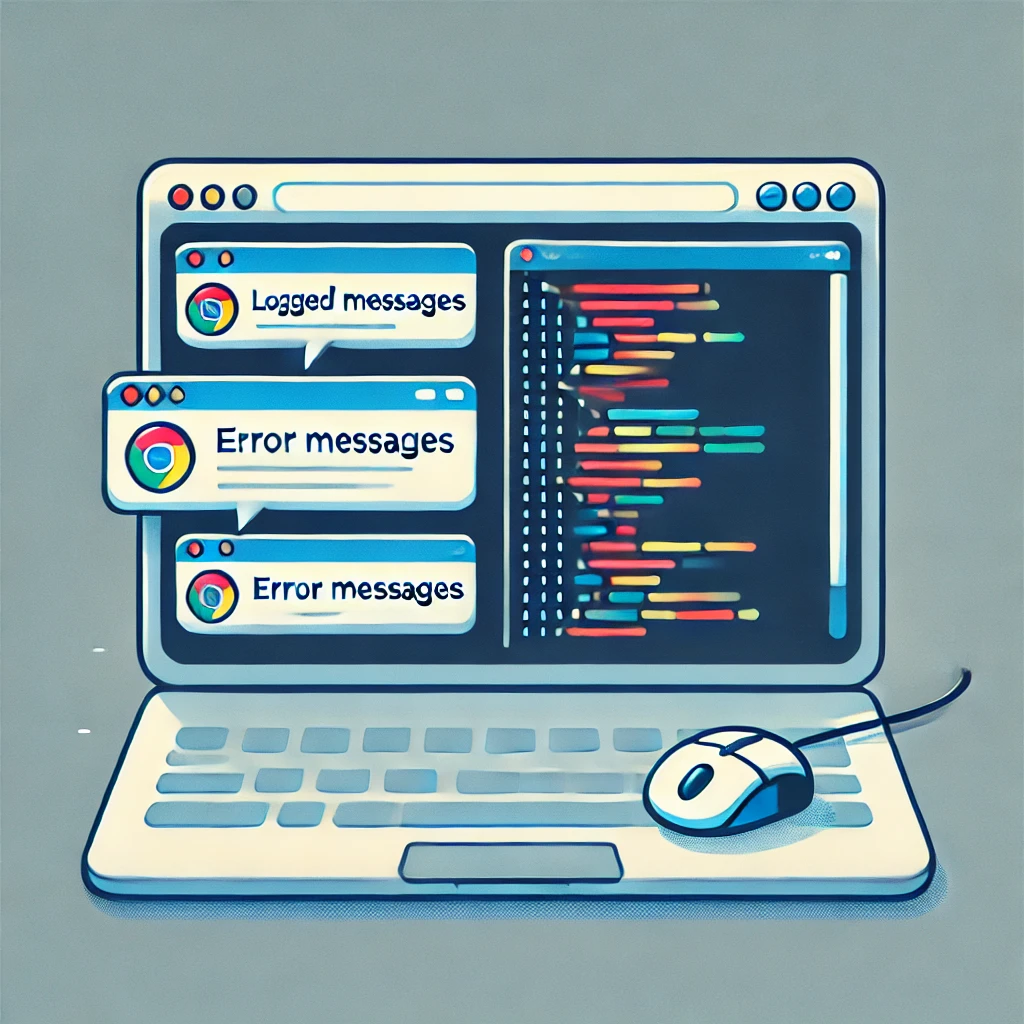
The Console in Chrome DevTools is an essential tool for web developers. It allows you to log messages, debug JavaScript code, and interact with the web page you are developing. You can access the console by opening Chrome DevTools (usually with F12 or Ctrl+Shift+I), and then navigating to the Console tab.

Key Functions of the Console:
Log Messages: Use
console.log()to print messages to the console, which helps in tracking the flow of code and inspecting variables.console.log('This is a log message!');Debug Code: Log errors and warnings to identify issues quickly.
Customizable: The console can be customized to show additional information and tools, such as filters for different log levels (info, warnings, errors).
Logging Errors
When there are errors in your code, they are displayed in red text in the Console. This visual cue helps developers quickly identify issues that need attention.
Using the Debugger
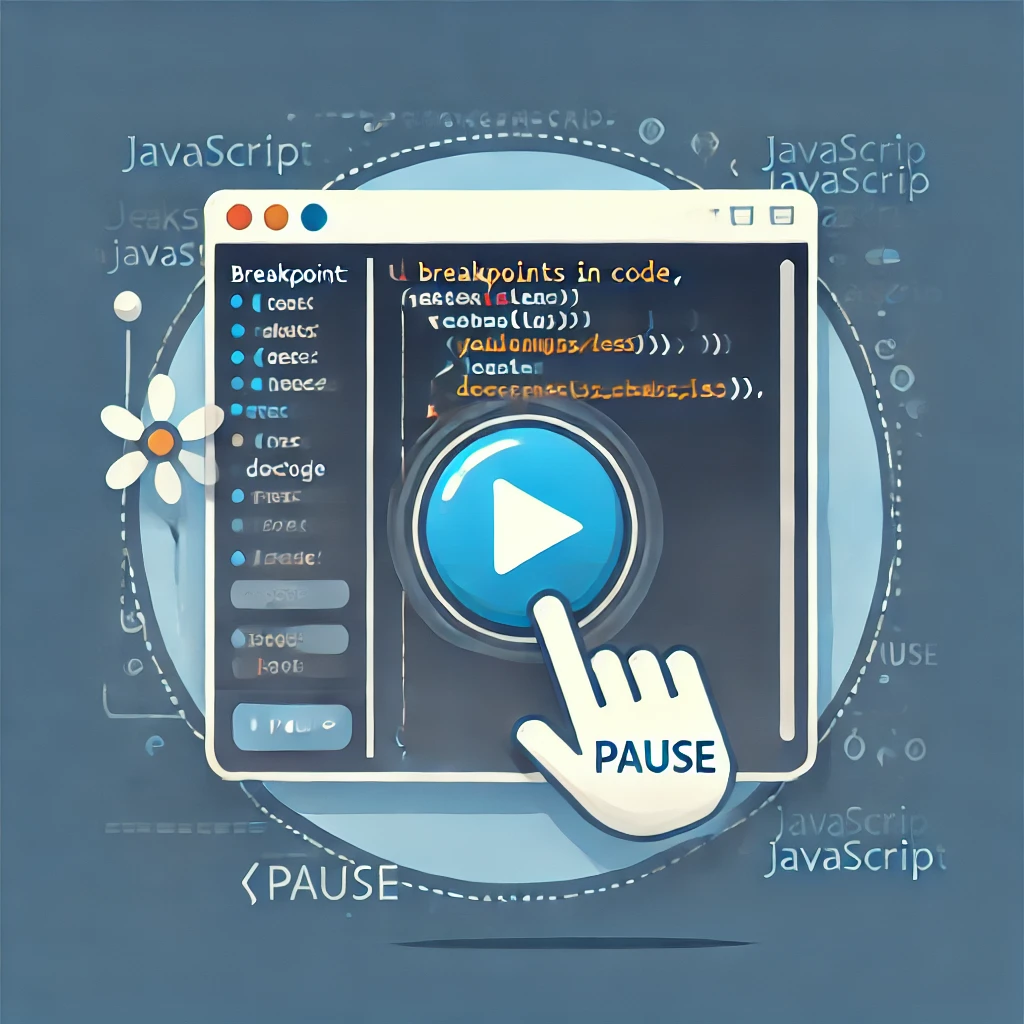
The Debugger in Chrome DevTools allows you to pause the execution of JavaScript code to inspect the state of variables at any given point.
Debugger Functions:
Pause Execution: Click the ‘pause’ button in the DevTools to halt code execution.
Break on Conditions: Set breakpoints that trigger when specific conditions are met.
Inspect Variables: While paused, view both local and global variables, providing insights into the current state of your application.
Setting Breakpoints
Breakpoints are markers you can set in your code that will pause execution at specific lines, which is particularly useful for understanding how your code operates.

Setting Breakpoints:
Using the Sources Tab: Navigate to the Sources tab, and click the ‘plus’ button next to the line number to set a breakpoint.
Using the Elements Tab: Right-click on a DOM element and choose ‘Break on this element’ to set a breakpoint for any JavaScript that interacts with that element.
Conditional Breakpoints: Set breakpoints that trigger only when certain conditions are met.
Stepping Through Code
Stepping through code allows you to execute your code line by line, giving you the ability to observe how variables change and how control flows through your application.
How to Step Through Code:
- Step Into/Over: Use the ‘step into’ (usually F11) to go into function calls, or ‘step over’ (usually F10) to execute the line without going into functions.
Catching Errors
Catching errors is crucial for maintaining application stability. By handling potential issues, you can prevent your application from crashing.
Techniques for Catching Errors:
Try-Catch Blocks: Use try-catch statements in your code to handle exceptions gracefully.
try {
    // Code that may throw an error
} catch (error) {
    console.error('Caught an error:', error);
}
Deactivating Breakpoints
Sometimes, you may want to deactivate breakpoints without removing them entirely. This feature allows you to test your application without losing your debugging markers.
Deactivating Breakpoints:
- Using the Pause Button: Click the pause button in the DevTools to deactivate breakpoints temporarily.
Conclusion
Imagine you’re building a piece of furniture. To make the job easier, you use special tools like a screwdriver, hammer, and instruction manual. Developer tools are just like that for software engineers! They help programmers build, test, and fix websites and apps. These tools make their work faster and smoother. So next time you use a website or app, remember it was created with the help of these handy developer tools!
TIPRemember! Using the right tools can make your coding adventure much more fun and efficient!